Anthropic Economic Index adds new usage metrics, finds faster US AI diffusion and revised productivity impact
Published Cached
-
 Image: AnthropicTable 2.1: Economic primitives added in this report.The table shows the new economic primitives added in this report, beyond collaboration patterns (automation/augmentation) from prior reports. The first column shows the primitive category, the second column the name of the primitive, and the third column the operationalization of the primitives as the prompts provided to Claude which we use a classifier to map conversations to primitives. See online appendix at https://huggingface.co/datasets/Anthropic/EconomicIndex for full prompt texts. (Anthropic) Source Full size
 -
 Image: AnthropicFigure 2.1: Education years needed to understand the human prompt and share of workers with at least a Bachelor’s Degree.Education data from “Educational attainment for workers 25 years and older by detailed occupation” (BLS), based on microdata from the 2022 and 2023 American Community Survey2. We calculate average years of schooling for tasks associated with a particular occupation. We then calculate the percentage of workers with a bachelor's degree or higher in that occupation. (Anthropic) Source Full size
 -
 Image: AnthropicFigure 2.2: Descriptive statistics of economic primitives overall and for two example request clusters.For this figure, we focus on descriptive statistics for the primitives across the whole Claude.ai sample as well as two request clusters at the lowest level of granularity. N indicates the overall count of conversations or the count of conversations belonging to the request clusters. (Anthropic) Source Full size
 -
 Image: AnthropicFigure 3.2: Per capita income predicts how Claude is used across countries.Each plot shows the bivariate relationship between the share of a specific use case (work, coursework, or personal) for Claude.ai conversations and log GDP per capita. Labels show the ISO-3166-1 country codes. We only include countries with at least 200 observations in our sample for this figure because of the uncertainty of the measure for low-usage countries in our random sample. The underlying data includes Claude.ai Free, Pro and Max usage. (Anthropic) Source Full size
 -
 Image: AnthropicFigure 3.3: Relationship between the Anthropic AI Usage Index and five core economic primitives and GDP per capita at the country level.Each plot shows the bivariate relationship between the natural logarithm of the Anthropic AI Usage Index and a core economic primitive as well as log GDP per capita. Labels show the ISO-3166-1 country codes. We only include countries with at least 200 observations in our sample for this figure because of the uncertainty of the measure for low-usage countries in our random sample. The underlying data includes Claude.ai Free, Pro and Max usage. See chapter 2 for detailed definitions of human only time, human education, AI autonomy, work use case and task success. (Anthropic) Source Full size
 -
 Image: AnthropicFigure 3.4: Relationship between the Anthropic AI Usage Index and five core economic primitives and GDP per capita at the US state level.Each plot shows the bivariate relationship between the natural logarithm of the Anthropic AI Usage Index and a core economic primitive as well as log GDP per capita. Labels show the ISO-3166-2 region codes6. We only include states with at least 100 observations in our sample for this figure because of the uncertainty of the measure for low-usage states in our random sample. The underlying data includes Claude.ai Free, Pro and Max usage. See chapter 2 for detailed definitions of human only time, human education, AI autonomy, work use case and task success. (Anthropic) Source Full size
 -
 Image: AnthropicFigure 3.5: Relationship between task success and human education.Plots on the left show the bivariate correlation between task success and years of education needed to understand the human prompts in the conversation. Plots on the right show partial regression where we additionally control for GDP per capita, AI autonomy, automation percent, share of work and coursework use cases, human without AI time, human with AI time, multitasking and human ability (see chapter 2 for detailed definitions of these variables). Labels show ISO-3166-1 country codes and ISO-3166-2 region codes. We only include countries with at least 200 and states with at least 100 observations in our sample for this figure because of the uncertainty of the measure for low-usage states in our random sample. The underlying data includes Claude.ai Free, Pro and Max usage. (Anthropic) Source Full size
 -
 Image: AnthropicFigure 4.1: Speed up (panel a) and Success rate (panel b) vs. Human years of schooling.The panel on the left shows a binned scatterplot of the bivariate relationship between speedup and human years of schooling, all measured at the O*NET task level and split by platform. The dashed lines show the fit from a linear regression. The panel on the right shows the same relationship with the success rate in the y-axis. (Anthropic) Source Full size
 -
 Image: AnthropicFigure 4.3: Task success vs. human-only time.The plot shows a binned scatterplot of the bivariate relationship between task success (%) and the time the task would require a human to complete alone, all measured at the O*NET task level and split by platform. The dashed lines show the fit from a linear regression. (Anthropic) Source Full size
 -
 Image: AnthropicFigure 4.4: Effective AI coverage vs. Task coverageThe plot shows a scatter of the bivariate relationship between task effective AI coverage (%) and task coverage, measured at the occupation level. Effective AI coverage tracks the share of a worker’s time-weighted duties that AI could successfully perform, based on Claude.ai data. Task coverage is the share of tasks that appear in Claude.ai usage. The dashed line shows where Effective AI coverage share equals task coverage. (Anthropic) Source Full size
 -
 Image: AnthropicFigure 4.5: Education level of all tasks vs. Claude-covered tasksThis shows two histograms. The blue bars give the distribution of the predicted task-level education required for all tasks in the O*NET database, weighted by employment. The orange bars show the same, restricting to tasks that appear in Claude.ai data. (Anthropic) Source Full size
 -
 Image: AnthropicFigure 4.6 Implied labor productivity effect from AI as a function of within-occupation task substitutabilityThis figure shows the implied aggregate labor productivity growth over the next decade based on efficiency gains estimated for tasks with at least 200 observations in our sample of 1M conversations on Claude.ai and 1M records from 1P API traffic. The elasticity of substitution governs how the degree to which non-AI enhanced tasks constrain the occupational productivity gains implied by Claude usage under a model in which occupational output is a CES index across tasks. An elasticity of =1 reproduces our unadjusted, baseline result of 1.8 percentage point increase in labor productivity growth over the next decade. Success-adjusted curves discount task-level speedups by task reliability. See text for more details. (Anthropic) Source Full size


New “economic primitives” quantify AI use across five dimensions.
The January 2026 report introduces task complexity, human/AI skill levels, use case (work, coursework, personal), AI autonomy, and task success as foundational measures derived from Claude’s analysis of anonymized Claude.ai and 1P API transcripts [1].
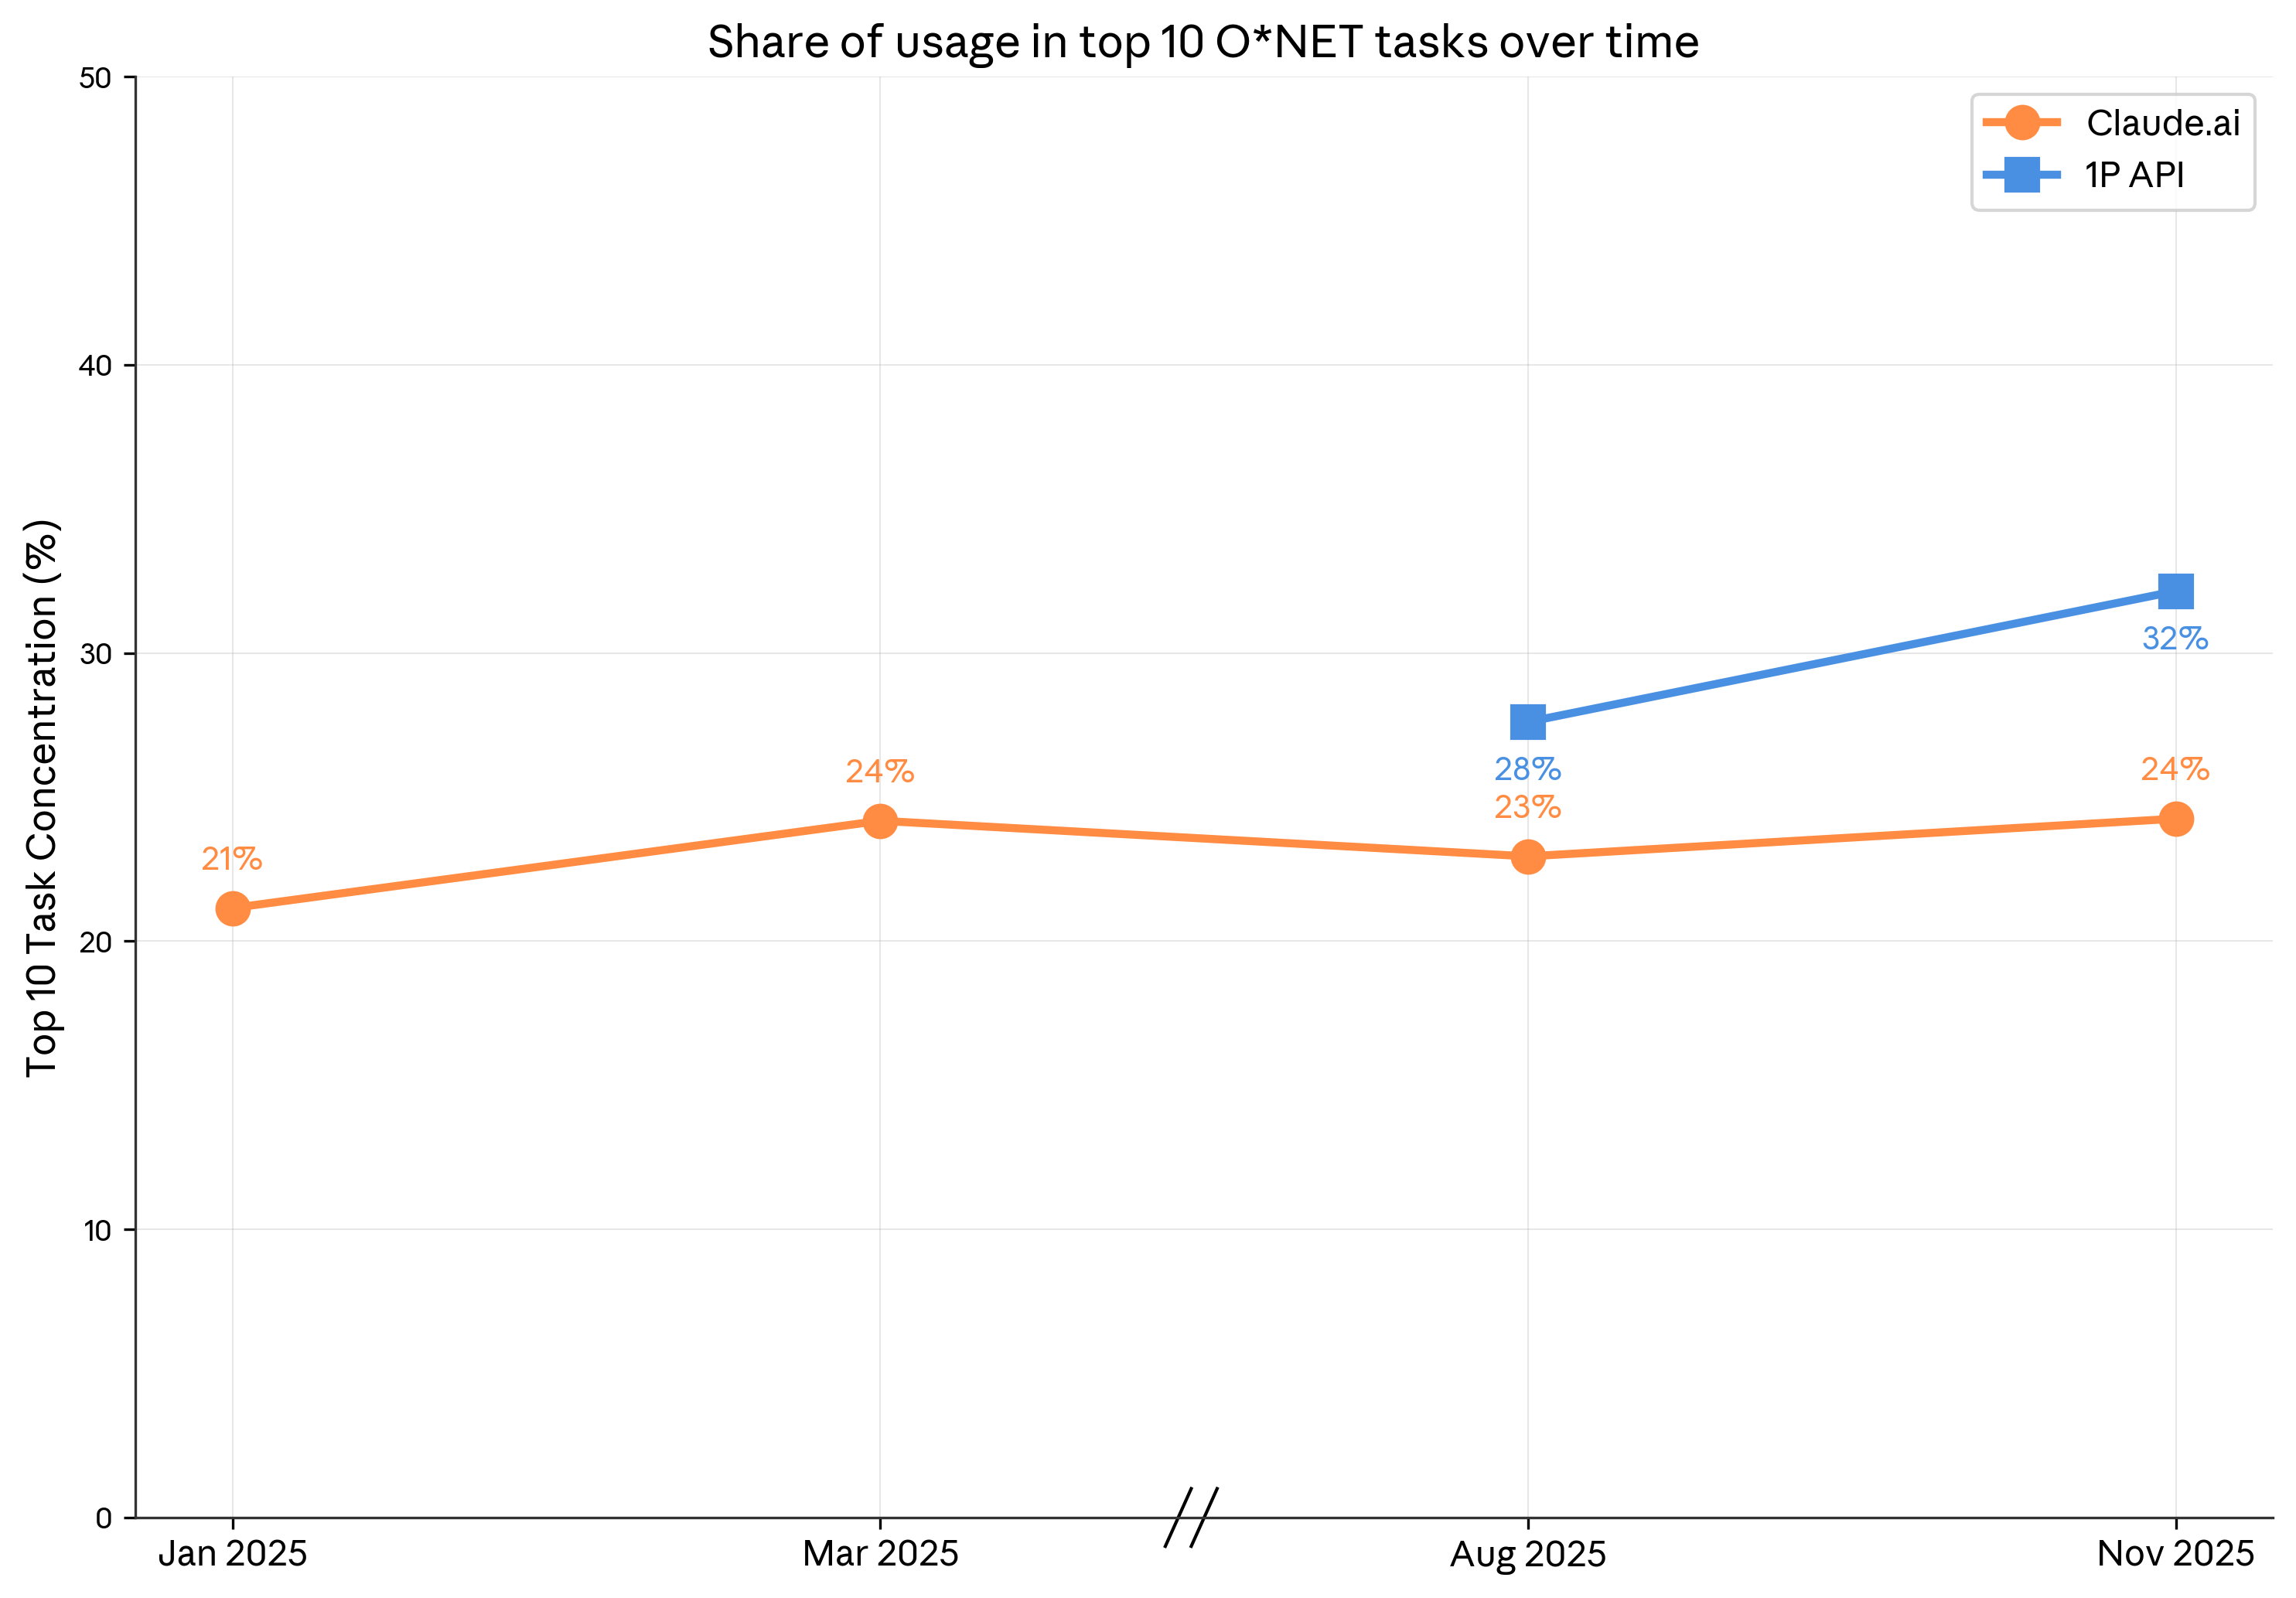
Claude usage stays task‑concentrated but augmentation now leads automation.
The ten most common tasks represent 24 % of consumer conversations and 32 % of API traffic, still dominated by coding, while augmented interactions rose to 52 % versus 45 % automated on Claude.ai [1].
Global adoption mirrors GDP gaps, yet US states are converging rapidly.
The Anthropic AI Usage Index (AUI) remains tightly linked to per‑capita income worldwide, but the US Gini coefficient fell from 0.37 to 0.32; diffusion models estimate per‑capita usage could equalize across states within 2–5 years—far faster than the ~50‑year spread of past technologies [1][9].
Success rates dip on longer, higher‑skill tasks, with mixed education effects.
Claude’s task success declines as human‑only time increases, echoing task‑horizon findings; across countries success correlates negatively with required education, while within US states the relationship appears positive but vanishes after controlling for other factors [1][25].
Adjusted productivity forecasts drop to about 1 % annual gain.
Incorporating task‑success probabilities cuts the projected AI‑driven labor‑productivity boost from 1.8 pp to roughly 1.0 pp per year; the effect ranges from 0.7–0.9 pp (tasks complementary, σ < 1) to 2.2–2.6 pp (tasks substitutable, σ > 1), per Hulten’s theorem and recent bottleneck analyses [1][42][37].
AI targets higher‑skill work, prompting net deskilling in many occupations.
Claude covers tasks requiring more education than the economy average, leading to deskilling for roles like technical writers and travel agents, while upskilling occurs in jobs such as real‑estate managers; this aligns with Autor and Thompson’s expertise framework [1][22].
Links
- [1] https://www.anthropic.com/research/anthropic-economic-index-january-2026-report
- [10] https://academic.oup.com/qje/article-abstract/140/2/1299/7959830
- [11] https://digitaleconomy.stanford.edu/publications/canaries-in-the-coal-mine/
- [12] https://www.anthropic.com/research/estimating-productivity-gains
- [13] https://www.hbs.edu/ris/Publication%20Files/26-011_04dcb593-c32b-4e4e-80fc-b51030cf8a12.pdf
- [14] https://www-cdn.anthropic.com/e5645986a7ce8fbcc48fa6d2fc67753c87642c30.pdf
- [15] https://arxiv.org/abs/2412.13678
- [16] https://www.anthropic.com/research/estimating-productivity-gains
- [17] https://digitaleconomy.stanford.edu/publications/canaries-in-the-coal-mine/
- [18] http://microsoft.com/en-us/research/wp-content/uploads/2025/12/New-Future-Of-Work-Report-2025.pdf
- [19] https://www.anthropic.com/research/clio
- [2] https://www.anthropic.com/research/anthropic-economic-index-september-2025-report
- [20] http://microsoft.com/en-us/research/wp-content/uploads/2025/12/New-Future-Of-Work-Report-2025.pdf
- [21] https://doi.org/10.48550/arXiv.2412.13678
- [22] https://economics.mit.edu/sites/default/files/2025-06/Expertise-Autor-Thompson-20250618.pdf
- [23] https://www.anthropic.com/research/estimating-productivity-gains
- [24] https://www.nber.org/system/files/working_papers/w32966/w32966.pdf
- [25] https://metr.org/blog/2025-03-19-measuring-ai-ability-to-complete-long-tasks/
- [26] http://claude.ai/redirect/website.v1.42774eff-6d50-40a5-a034-42f42653415e
- [27] https://assets.anthropic.com/m/2e23255f1e84ca97/original/Economic_Tasks_AI_Paper.pdf
- [28] https://www.anthropic.com/research/estimating-productivity-gains
- [29] https://economics.mit.edu/sites/default/files/2025-06/Expertise-Autor-Thompson-20250618.pdf
- [3] https://arxiv.org/abs/2503.14499
- [30] https://www.nber.org/papers/w33509
- [31] https://economics.mit.edu/sites/default/files/2025-06/Expertise-Autor-Thompson-20250618.pdf
- [32] https://www.anthropic.com/research/estimating-productivity-gains
- [33] http://claude.ai/redirect/website.v1.42774eff-6d50-40a5-a034-42f42653415e
- [34] https://www.anthropic.com/research/estimating-productivity-gains
- [35] http://claude.ai/redirect/website.v1.42774eff-6d50-40a5-a034-42f42653415e
- [36] http://claude.ai/redirect/website.v1.42774eff-6d50-40a5-a034-42f42653415e
- [37] https://www.nber.org/papers/w34639
- [38] https://huggingface.co/datasets/Anthropic/EconomicIndex
- [39] https://arxiv.org/pdf/2507.07935
- [4] https://claude.com/blog/create-files
- [40] https://www.michaelwebb.co/webb_ai.pdf
- [41] http://claude.ai/redirect/website.v1.42774eff-6d50-40a5-a034-42f42653415e
- [42] https://doi.org/10.3982/ECTA15202
- [5] https://claude.com/blog/memory
- [6] https://claude.com/blog/skills
- [7] http://claude.ai/redirect/website.v1.42774eff-6d50-40a5-a034-42f42653415e
- [8] http://claude.ai/redirect/website.v1.42774eff-6d50-40a5-a034-42f42653415e
- [9] https://academic.oup.com/qje/article-abstract/140/2/1299/7959830