Anthropic’s Economic Index Shows AI Boosts Complex Tasks but Raises Deskilling Concerns
Published Cached
-
 Image: AnthropicSpeedup and success rate vs. human years of schooling. The chart on the left shows a scatterplot of the relationship between speedup and human years of schooling, measured at the O*NET task level. The dashed lines show the line of best fit. The chart on the right shows the relationship with the success rate. (Anthropic) Source Full size
-
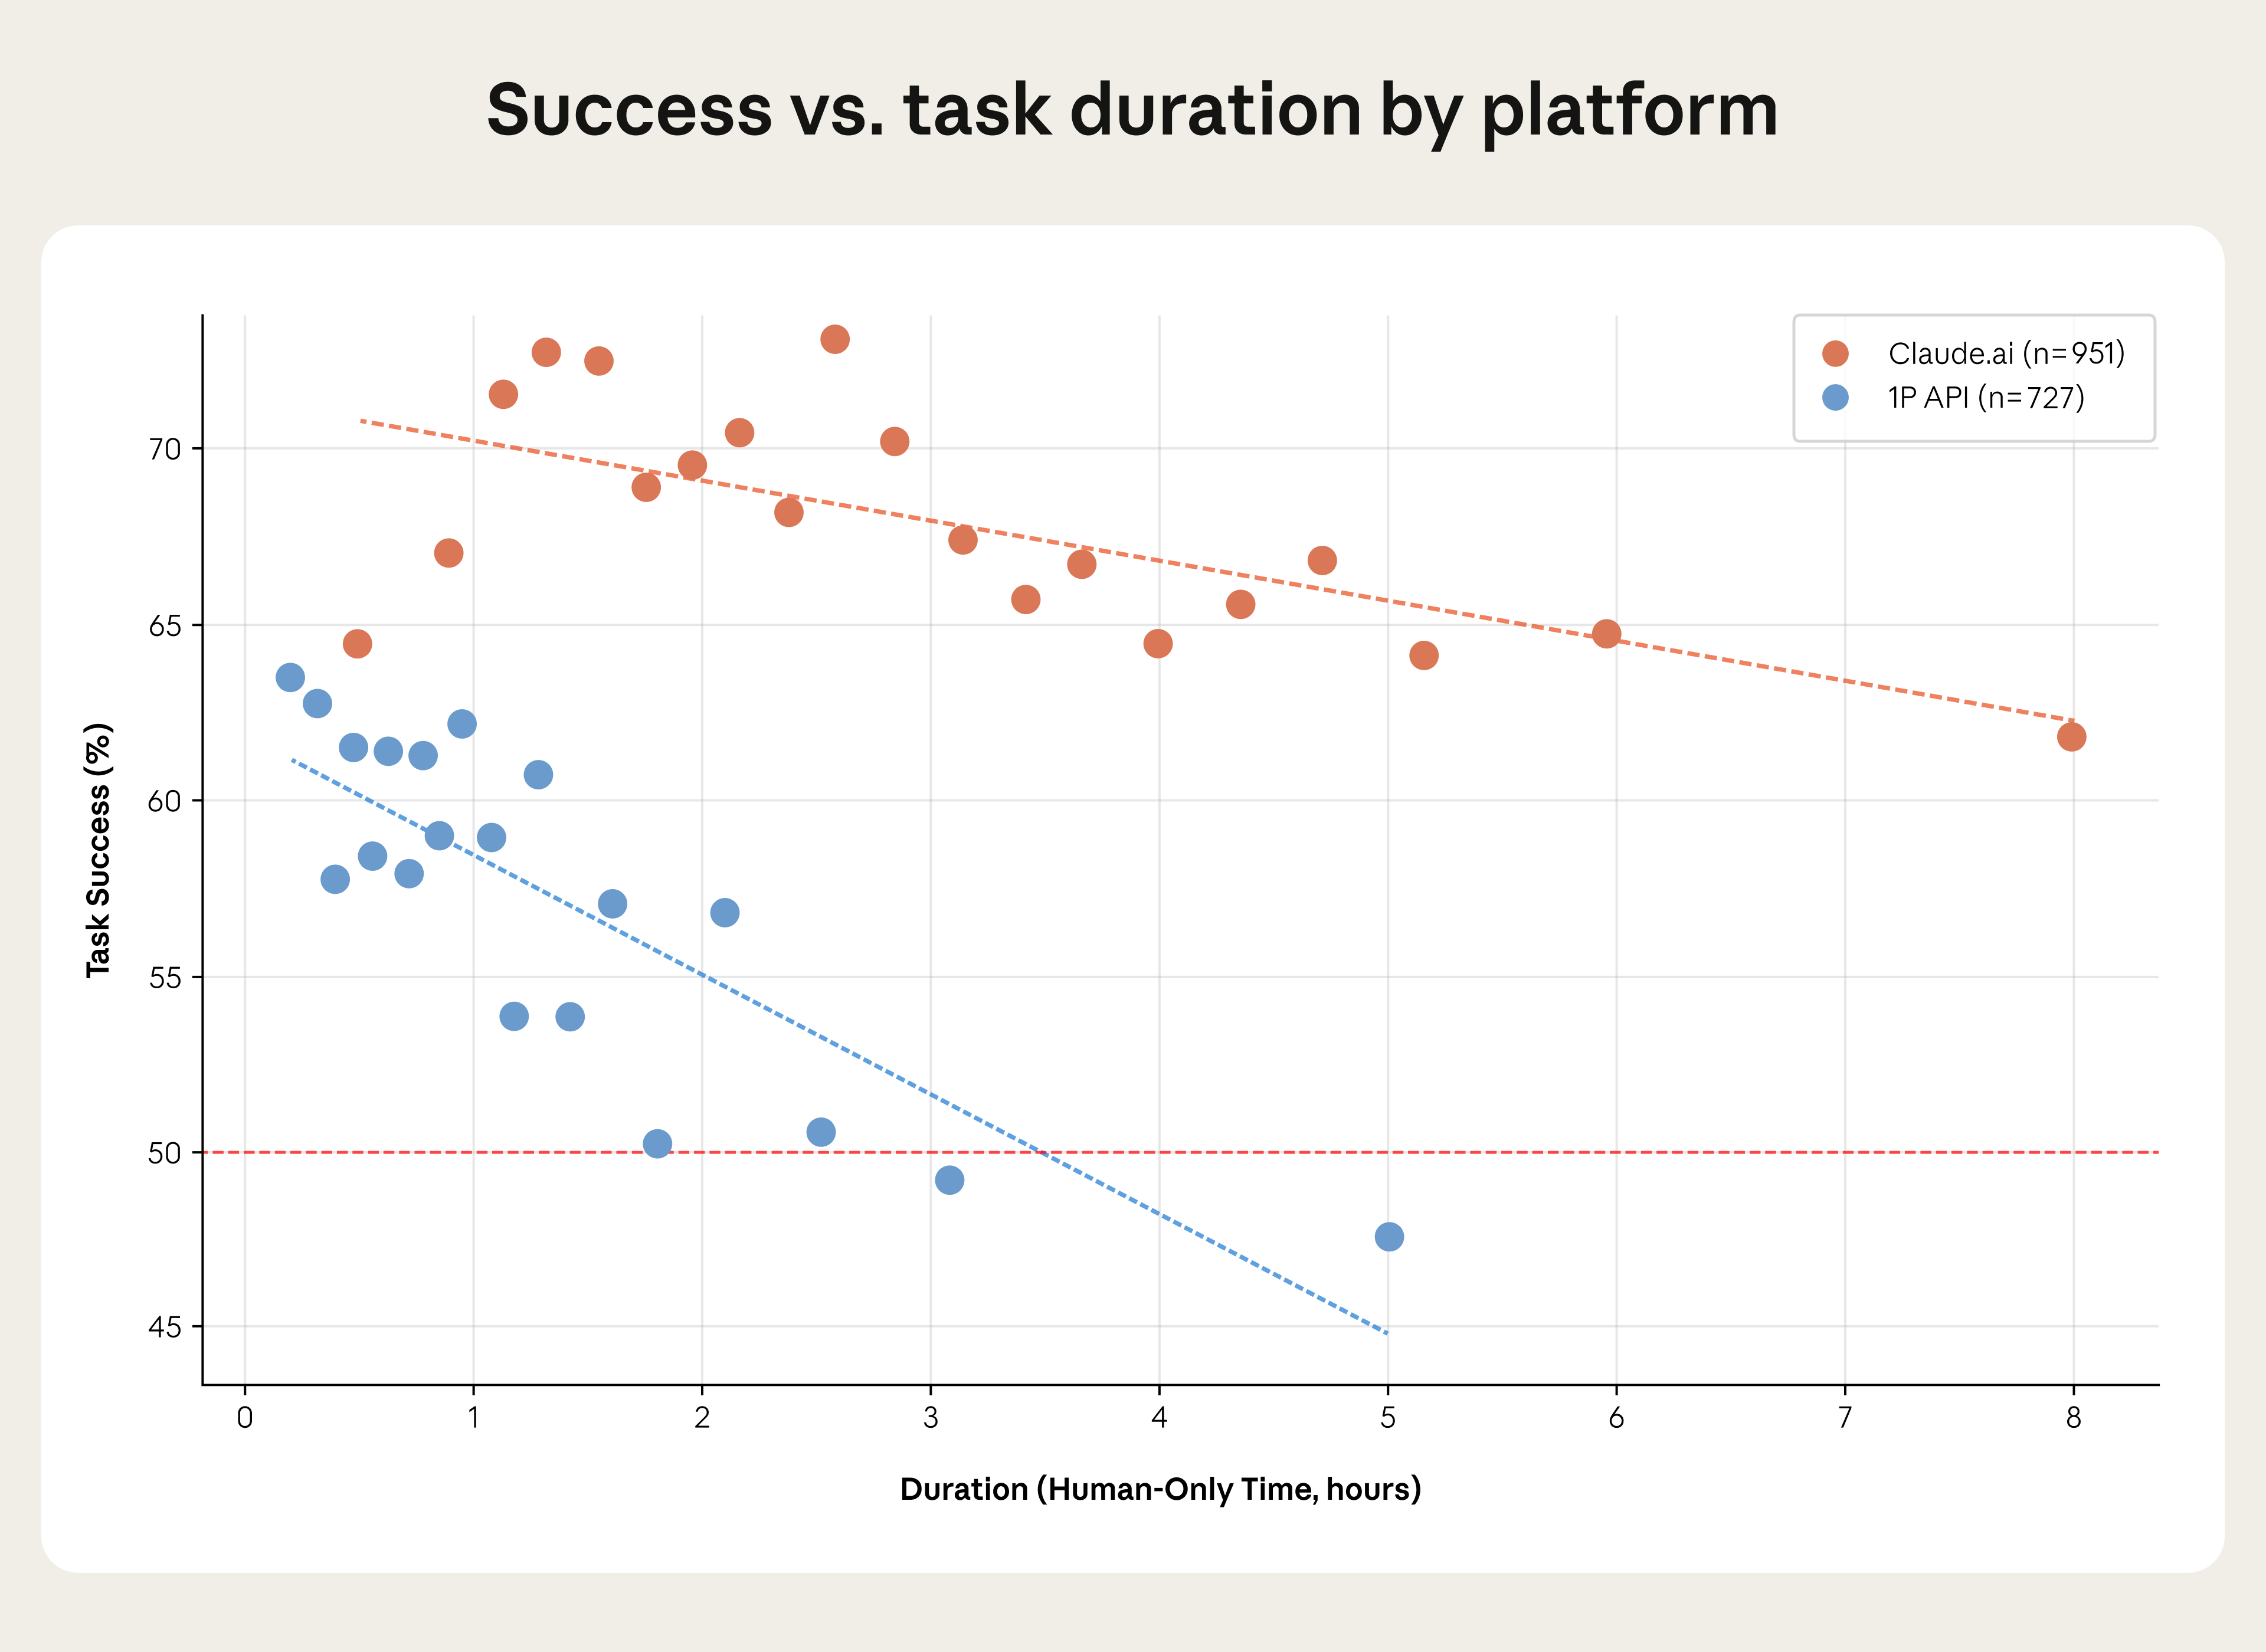 Image: AnthropicTask success vs. human-only time. This chart shows the relationship between task success (%) and the time the task would require a human to complete alone, all measured at the O*NET task level and split by platform. The dashed lines show the fit from a linear regression. (Anthropic) Source Full size
-
 Image: AnthropicEffective AI coverage vs. task coverage. The plot shows the relationship between task effective AI coverage (%) and task coverage, measured at the occupation level. Effective AI coverage tracks the share of a worker’s time-weighted duties that AI could successfully perform, based on Claude.ai data. Task coverage is the share of tasks that appear in Claude.ai usage. The dashed line shows where effective AI coverage share equals task coverage. (Anthropic) Source Full size
-
 Image: AnthropicEducation level of all tasks vs. Claude-covered tasks. The blue bars give the distribution of the predicted task-level education required for all tasks in the O*NET database, weighted by employment. The orange bars show the same, restricting to tasks that appear in Claude.ai data. (Anthropic) Source Full size

New “economic primitives” track AI impact Anthropic’s fourth Economic Index adds five foundational metrics—task complexity, skill level, purpose, AI autonomy, and success—derived from Claude’s answers to a standard questionnaire applied to November 2025 conversations, primarily using Claude Sonnet 4.5; the approach builds on Anthropic’s privacy‑preserving analysis method [1][2].
Complex tasks see highest speedups, with modest success Claude speeds up high‑school‑level tasks by a factor of 9 and college‑level tasks by 12, while API data show even larger gains; success rates drop slightly for higher‑skill tasks (66 % vs 70 % for lower‑skill), confirming that productivity gains concentrate in high‑human‑capital work, consistent with NBER findings on white‑collar AI use [1][9].
Task‑time horizons differ from METR benchmarks METR’s task‑horizon metric indicates 50 % success at 2 hours for Claude Sonnet 4.5, whereas Anthropic’s API data show 50 % success at 3.5 hours and Claude.ai at about 19 hours, reflecting user‑driven task decomposition and selection bias [1][10][11].
Higher‑income countries favor work and personal use In nations with greater GDP per capita, Claude is employed more for work or personal purposes, while lower‑income regions use it mainly for coursework; this mirrors Microsoft research on AI adoption and underpins Anthropic’s Rwanda‑government partnership to transition users from education to broader applications [1][13][14].
AI covers higher‑skill tasks, hinting at deskilling Across occupations, Claude usage has risen from 36 % to 49 % of jobs handling at least a quarter of tasks; adjusted metrics reveal disproportionate impact on roles like data‑entry keyers and radiologists, and the average education level of Claude‑covered tasks is 14.4 years versus the economy’s 13.2, suggesting a potential net‑deskilling effect if those tasks were automated [1].
Revised productivity gains estimate falls to ~1 % Earlier Anthropic work projected AI could add 1.8 percentage points to US labor‑productivity growth annually; applying the new primitives and accounting for task‑success probabilities lowers the estimate to 1.2 pp for Claude.ai and 1.0 pp for API work, still enough to return productivity to late‑1990s levels [1][17].
Links
- [1] https://www.anthropic.com/research/economic-index-primitives
- [2] https://www.anthropic.com/research/clio
- [3] http://claude.ai/redirect/website.v1.b6923fba-26b4-4363-8e80-0cc1d883128d
- [4] https://www.anthropic.com/news/the-anthropic-economic-index
- [5] https://www.anthropic.com/research/impact-software-development
- [6] https://www.anthropic.com/research/economic-index-geography
- [7] /research/anthropic-economic-index-january-2026-report
- [8] anthropic.com/research/anthropic-economic-index-january-2026-report
- [9] https://www.nber.org/papers/w32966
- [10] https://metr.org/
- [11] https://metr.org/blog/2025-03-19-measuring-ai-ability-to-complete-long-tasks/
- [12] http://claude.ai/redirect/website.v1.b6923fba-26b4-4363-8e80-0cc1d883128d
- [13] http://microsoft.com/en-us/research/wp-content/uploads/2025/12/New-Future-Of-Work-Report-2025.pdf
- [14] https://www.anthropic.com/news/rwandan-government-partnership-ai-education
- [15] https://www.anthropic.com/news/the-anthropic-economic-index
- [16] anthropic.com/research/anthropic-economic-index-january-2026-report
- [17] https://www.anthropic.com/research/estimating-productivity-gains
- [18] http://claude.ai/redirect/website.v1.b6923fba-26b4-4363-8e80-0cc1d883128d
- [19] https://www.anthropic.com/research/estimating-productivity-gains
- [20] http://claude.ai/redirect/website.v1.b6923fba-26b4-4363-8e80-0cc1d883128d
- [21] https://www.anthropic.com/research/economic-index-geography
- [22] anthropic.com/research/anthropic-economic-index-january-2026-report
- [23] http://claude.ai/redirect/website.v1.b6923fba-26b4-4363-8e80-0cc1d883128d
- [24] /research/anthropic-economic-index-january-2026-report