Washington Gas Prices Reach $4.29 per Gallon as Sunday Remains Cheapest Nationwide
Updated (11 articles)

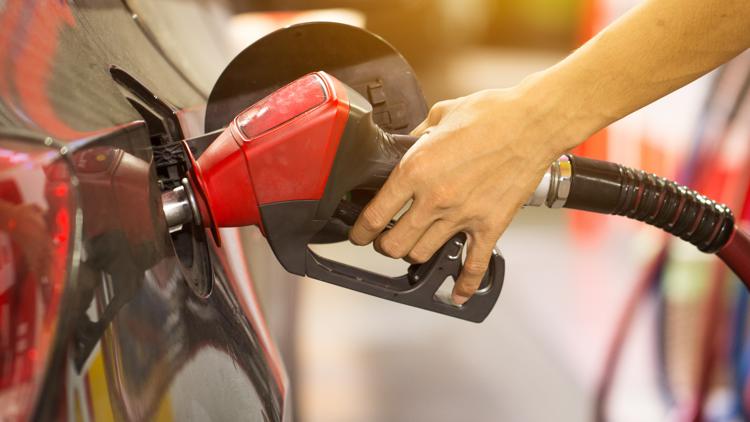

Washington Pump Prices Surge to $4.29 per Gallon The average regular‑gas price in Washington hit $4.29 on Feb. 22, a 6‑cent rise from the previous day, 16 cents higher than a week earlier and 47 cents above the Jan. 12 level [1]. The state now ranks third‑highest in the nation, trailing only California and Hawaii [1]. The increase follows a month‑long climb from about $3.79 to $4.18, as reported by the EIA [1].
Seasonal Blend Switch and Refinery Maintenance Drive Costs Experts link the price jump to the transition to a summer‑blend gasoline that requires lower volatility, raising production expenses [1]. Concurrent refinery maintenance further curtails output, especially on the West Coast, amplifying the price pressure [1]. These factors, combined with tighter regional logistics and stricter environmental standards, elevate refining and distribution costs [1].
Geopolitical Tensions Add Crude Price Pressure Analysts cite uncertainty over U.S.–Iran relations as a catalyst for higher crude‑oil prices, which constitute roughly 47 % of a gallon’s cost [1]. The crude component’s volatility feeds directly into pump prices, reinforcing the upward trend [1].
GasBuddy Finds Sunday Cheapest Nationwide, Mid‑Week Peaks GasBuddy’s year‑long analysis shows Sunday as the lowest‑priced day in virtually every state, while Wednesday or Thursday registers the highest rates [2][3][4]. Drivers can shave 4–9 cents per gallon by filling up on Sundays instead of mid‑week [2]. The weekly rhythm persists despite forecasts of a 2026 five‑year low in national gasoline prices [2].
State‑Specific Price‑Cycling Offers Up to $0.45 Savings In markets such as Michigan, Indiana, Ohio, Florida, Texas and parts of the West Coast, prices spike sharply then decline, allowing a 5‑7‑day wait to save 15–45 cents per gallon [3][4]. State‑by‑state best‑day variations include Monday in Alaska, Delaware, Indiana and Ohio; Tuesday in Montana; and Saturday in Kansas, Pennsylvania, South Dakota and Wyoming [3][4]. GasBuddy advises using its app to monitor local rates and to exercise caution on Tuesdays and Saturdays, which tend to be pricier [3][4].
Sources
-
1.
King5: Washington Gas Prices Near $4.30, Third Highest in Nation: reports Washington’s average regular‑gas price at $4.29 per gallon, a 6‑cent daily rise and the state’s third‑highest ranking, attributing the surge to summer‑blend fuel, refinery maintenance, and U.S.–Iran geopolitical tension .
-
2.
Newsweek: Best Day to Buy Gas: Sunday Cheapest, Midweek Most Expensive Across States: highlights GasBuddy’s finding that Sundays are cheapest in most states, mid‑week days most expensive, and notes potential 4–9 cent savings per gallon, while explaining California’s high baseline prices .
-
3.
WBNS: Sunday Is Cheapest Day for Fuel, GasBuddy Report Finds: emphasizes the nationwide Sunday price dip, mid‑week peaks, and quantifies 15–45 cent savings in “price‑cycling” states, also noting state‑specific cheapest days like Monday in Alaska and Saturday in Kansas .
-
4.
King5: GasBuddy Report Finds Sunday Cheapest for Fuel, Mid‑Week Prices Higher: mirrors WBNS’s coverage, stressing Sunday’s low rates, Wednesday‑Friday spikes, and the recommendation to use price‑checking apps while warning about higher prices on Tuesdays and Saturdays .
Related Tickers
Timeline
2020 – GasBuddy records the national average gasoline price at $2.17 per gallon, establishing the low benchmark that 2026 forecasts aim to approach again [3].
May 2, 2021 – The nationwide average sits at $3.125 per gallon on the day President Trump takes office, marking a recent historical high for comparison [4].
Nov 30, 2025 – The U.S. average gasoline price dips below $3 per gallon for the first time in more than four years, with every state reporting lower prices and dozens of stations in Oklahoma, Colorado and Texas selling at $1.99 [8][11]; GasBuddy’s Patrick De Haan calls the breadth of the decline “remarkable.”
Dec 2, 2025 – The national average falls to $2.998 per gallon, the lowest since May 2021, as crude oil slides to about $59 a barrel thanks to higher U.S. production and OPEC output [1]; analysts warn that if OPEC does not curb supply, Brent could slip into the low $50s in Q4 2026 and the $40s by year‑end [1].
Dec 4, 2025 – Columbus’s 10TV launches an interactive map showing local low‑price stations while noting the national average has dropped below $3 for the first time in four years [7].
Dec 8, 2025 – GasBuddy reports a national average of $2.897 per gallon, the lowest in roughly 1,680 days; California remains the most expensive at $4.414, Oklahoma the cheapest at $2.298, and a few stations begin offering gas under $2 as OPEC increases December production [4].
Dec 23, 2025 – AAA data confirms December as the cheapest month of the year, with the national average hovering around $2.85‑$2.86 and WTI crude trading below $60 per barrel, though consumers still face high grocery prices and tariffs [5].
Jan 7, 2026 – GasBuddy forecasts the 2026 annual average at $2.97 per gallon, the lowest since 2020, while current pump prices sit near $2.81‑$2.82; former President Trump declares prices are falling “tremendously,” but Patrick De Haan cautions the decline stems from global oil markets, not presidential policy [3]; the firm expects a spring uptick to the low $3.20s before easing to about $2.80 by December.
Feb 19, 2026 – GasBuddy’s year‑long analysis finds Sunday to be the cheapest day for fuel nationwide, with mid‑week (Wednesday‑Friday) prices highest, allowing drivers to save 4‑9 cents per gallon by timing fill‑ups; state‑specific best‑day patterns vary, and the weekly cycle persists despite forecasts of a five‑year‑low price environment in 2026 [2][6][10].
Feb 22, 2026 – Washington’s average regular‑gas price reaches $4.29 per gallon, up 6 cents from the prior day, driven by the seasonal switch to summer‑blend gasoline, refinery maintenance, and heightened geopolitical tension over U.S.–Iran relations, which together raise crude’s share of pump costs to roughly 47 % [9].
Dive deeper (3 sub-stories)
All related articles (11 articles)
-
King5 (Seattle, WA): Washington Gas Prices Near $4.30, Third Highest in Nation
-
Newsweek: Best Day to Buy Gas: Sunday Cheapest, Midweek Most Expensive Across States
-
WBNS (Columbus, OH): Sunday Is Cheapest Day for Fuel, GasBuddy Report Finds
-
King5 (Seattle, WA): GasBuddy Report Finds Sunday Cheapest for Fuel, Mid‑Week Prices Higher
-
Newsweek: GasBuddy forecasts U.S. average gas below $3 in 2026, lowest annual price since 2020
-
AP: US gas prices dip to December low, AAA data show
-
Newsweek: Gas Prices Plunge to Lowest Level in Nearly Five Years
-
WBNS (Columbus, OH): Columbus Gas Prices: Current Lowest Rates and Interactive Map
-
CNN: US Gas Prices Drop Below $3 a Gallon for First Time Since May 2021
-
WBNS (Columbus, OH): National Gas Prices Drop Below $3 for First Time in Four Years
-
King5 (Seattle, WA): National Gas Prices Drop Below $3 for First Time in Four Years
External resources (7 links)
- https://blog-content.gasbuddy.com/uploads/2026/02/Best-Day-2026_By-State-1.pdf (cited 4 times)
- https://gasprices.aaa.com/ (cited 3 times)
- https://www.gasbuddy.com/ (cited 2 times)
- https://www.gasbuddy.com/go/best-day-gas-2026 (cited 2 times)
- https://www.gasbuddy.com/newsroom/pressrelease/2025/11/28/1165 (cited 2 times)
- https://interactive.10tv.com/iframes/GasBuddyChartUpdate.html (cited 1 times)
- https://www.gasbuddy.com/go/2026-fuel-price-outlook (cited 1 times)